Multiple Choice
Use the figure below to answer the following question(s) .
Figure 4-13
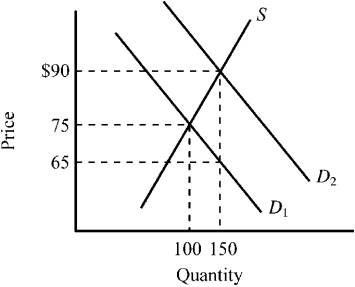
-Refer to Figure 4-13.The supply curve S and the demand curve D₁ indicate initial conditions in the market for flu shots.A new government program is implemented that grants buyers a $25 subsidy when they buy a flu shot,shifting the demand curve from D₁ to D₂.Which of the following is true for this subsidy given the information provided in the figure?
A) The original price of a flu shot was $75,and after the subsidy,it rises to $90.
B) $65 represents the net price a buyer must pay for a flu shot after taking into account the subsidy payment.
C) Buyers of flu shots will receive an actual benefit of $10 from the subsidy,while sellers of flu shots will receive an actual benefit of $15 from the subsidy.
D) All of the above are true.
Correct Answer:

Verified
Correct Answer:
Verified
Q40: A price ceiling that sets the price
Q48: Kathy works full time during the day
Q109: A price ceiling set below an equilibrium
Q141: Figure 4-24<br> <img src="https://d2lvgg3v3hfg70.cloudfront.net/TB3951/.jpg" alt="Figure 4-24
Q156: Which of the following examples illustrates a
Q160: A $25 government subsidy paid directly to
Q194: A politician was recently quoted as saying,
Q203: Which of the following statements about rent
Q214: An increase in the demand for a
Q232: Joanne states, "If raising the minimum wage