Multiple Choice
Table 5-1B
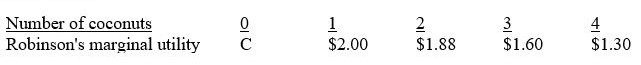
-If a graph of Robinson's marginal utility were constructed from Table 5-1B, it would
A) illustrate the "law" of diminishing marginal utility.
B) be a negatively sloped curve.
C) illustrate a typical consumer's satisfaction derived from consumption of consecutive units of a good.
D) All of the above are correct.
Correct Answer:

Verified
Correct Answer:
Verified
Q6: Marginal utility is<br>A)the difference in price between
Q12: Figure 5-8 <img src="https://d2lvgg3v3hfg70.cloudfront.net/TB8592/.jpg" alt="Figure 5-8
Q31: Consumers should purchase a good up to
Q44: Which of the following statements is correct?<br>A)The
Q98: Total utility increases if one more unit
Q152: Figure 5-15 <img src="https://d2lvgg3v3hfg70.cloudfront.net/TB8592/.jpg" alt="Figure 5-15
Q183: You have five hours left to study
Q198: Economists consider instances of increasing marginal utility
Q212: By changing the amount of income a
Q240: Use consumer indifference curves and budget lines