Essay
Table 5-3 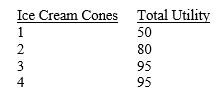
-Using Table 5-3, graph the marginal utility curve.
Correct Answer:

Verified
Correct Answer:
Verified
Related Questions
Q49: Figure 5-16 <img src="https://d2lvgg3v3hfg70.cloudfront.net/TB8592/.jpg" alt="Figure 5-16
Q73: If total utility declines as an additional
Q97: Suppose the price of butter falls because
Q131: If a commodity is inexpensive and its
Q135: If a good has "snob appeal," consumers
Q146: Consumer's surplus can be written as<br>A)total expenditure
Q150: Marginal utility is measured by the maximum
Q164: Points along a budget line represent the
Q196: Consumers should purchase quantities of a good
Q209: An increase in a consumer's income will