Multiple Choice
Figure 6-2
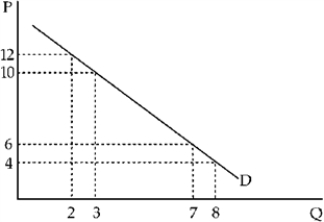
-From Figure 6-2, we can infer that demand is ____ between P = 12 and P = 10 and ____ between P = 6 and P = 4.
A) elastic; elastic
B) elastic; inelastic
C) inelastic; elastic
D) inelastic; inelastic
Correct Answer:

Verified
Correct Answer:
Verified
Related Questions
Q12: How might a market research analyst use
Q14: Why is it customary to report price
Q56: If the demand for gasoline becomes more
Q63: Necessities such as food and shelter have
Q96: Elasticity of demand is calculated using percentage
Q114: For each pair of goods, explain which
Q145: The local symphony recently raised its price
Q153: Julia knows the price elasticity of movie
Q157: The elasticity measure which has been employed
Q197: A straight-line demand curve has an elasticity