Multiple Choice
Figure 12-2
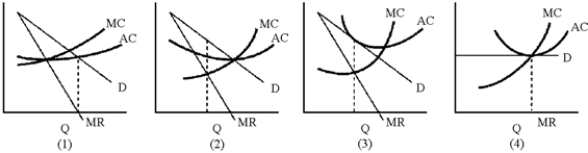
-In Figure 12-2, which of the graphs represents a firm that is a sales revenue maximizer?
A) 1
B) 2
C) 3
D) 4
Correct Answer:

Verified
Correct Answer:
Verified
Related Questions
Q67: The demand curve facing a monopolistically competitive
Q97: International trade can be correctly considered as
Q136: Figure 12-2<br> <img src="https://d2lvgg3v3hfg70.cloudfront.net/TB2282/.jpg" alt="Figure 12-2
Q140: Define the following terms and explain their
Q142: Which of the following characteristics of perfect
Q150: Probably the simplest approach to the problem
Q168: The contestable market theory best applies to<br>A)pure
Q210: Where interdependence is especially pronounced, competition among
Q213: Define the following terms and explain their
Q243: The theory of the kinked demand curve