Multiple Choice
Figure 12-3
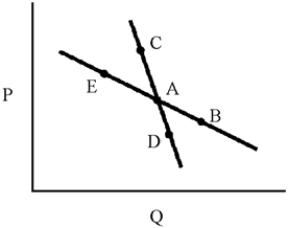
-In Figure 12-3, demand curve CAD represents a market in which oligopolists will match the price changes of rivals and demand curve EAB represents a market in which oligopolists will ignore the price changes of rivals.According to the kinked demand model, the relevant demand curve will be
A) demand curve CAB.
B) demand curve CAD.
C) demand curve EAD.
D) demand curve EAB.
Correct Answer:

Verified
Correct Answer:
Verified
Q17: The excess capacity theorem states that<br>A)society is
Q22: The demand curve for a monopolistic competitor
Q87: Which oligopoly model leads to price rigidity?
Q135: The most widely used approach for the
Q147: The short-run equilibrium of the firm under
Q203: If firms meet together to decide on
Q205: Oligopolistic firms never collude because they have
Q229: Which of the following is an example
Q230: Game theory can be used to investigate<br>A)why
Q246: In _, each competing firm is determined