Multiple Choice
Figure 8-1
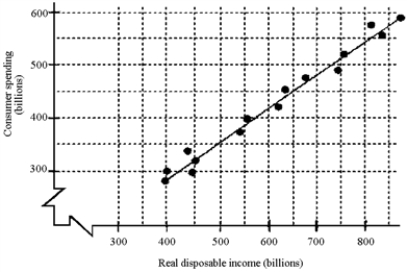
-Given the scatter diagram in Figure 8-1, how much will consumption decrease if the price level rises by 5 percent?
A) $50 billion
B) $100 billion
C) $200 billion
D) cannot be determined
Correct Answer:

Verified
Correct Answer:
Verified
Related Questions
Q6: A change in the value of consumer's
Q47: The net export component of aggregate demand
Q53: Capital goods are counted the same as
Q77: The relationship between consumer spending and disposable
Q118: If DI falls by $100 billion, and
Q156: When computing gross domestic product, government services
Q184: GDP can be calculated by the value-added
Q188: In the circular flow model, which of
Q189: Taxes add to and transfers subtract from
Q190: Changes in the price level affect household