Multiple Choice
Figure 10-9
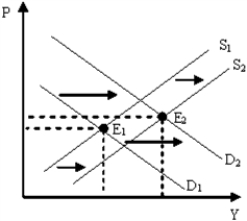
-Figure 10-9 describes which of the following periods in the U.S.?
A) 1930s
B) 1973-1975
C) late 1990s
D) 2007-2009
Correct Answer:

Verified
Correct Answer:
Verified
Related Questions
Q108: As long as the multiplier process is
Q157: If the price level rises, what will
Q161: Aggregate supply can be thought of as<br>A)a
Q168: A shift outward of the aggregate supply
Q171: Resource prices are fixed for some period
Q174: If the price level falls, what will
Q181: The case for government stabilization policy is
Q189: If the price level decreases, what will
Q204: At levels of output close to full
Q226: Stabilization policy may be necessary to slow