Multiple Choice
Figure 11-3
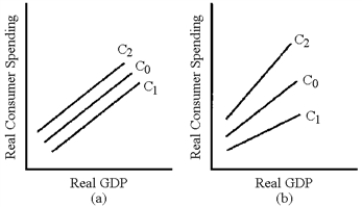
-In Figure 11-3, which line represents the change in the consumption schedule caused by a cut in fixed taxes?
A) C₁ in graph (a)
B) C2 in graph (a)
C) C₁ in graph (b)
D) C2 in graph (b)
Correct Answer:

Verified
Correct Answer:
Verified
Q53: Figure 11-1<br> <img src="https://d2lvgg3v3hfg70.cloudfront.net/TB8592/.jpg" alt="Figure 11-1
Q64: A tax reduction shifts the consumption schedule
Q79: Critics of supply-side economics argue that a
Q80: If a "conservative" wanted to increase aggregate
Q82: Which of the following is one of
Q88: If all variable taxes in the United
Q95: As a general rule, when an income
Q138: As a result of the recent financial
Q180: Table 11-1 <img src="https://d2lvgg3v3hfg70.cloudfront.net/TB8592/.jpg" alt="Table 11-1
Q193: The difference between a fixed tax and