Multiple Choice
Figure 11-3
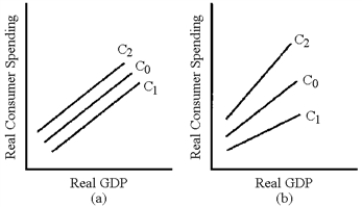
-In Figure 11-3, which line represents the change in the consumption schedule caused by an increase in the residential property tax?
A) C₁ in graph (a)
B) C2 in graph (a)
C) C₁ in graph (b)
D) C2 in graph (b)
Correct Answer:

Verified
Correct Answer:
Verified
Q10: The Japanese economy is stuck in a
Q61: Policy makers and citizens who want to
Q130: If the MPC in the U.S.was low,
Q133: Which of the following factors has the
Q135: Suppose that the U.S.personal income tax was
Q136: The president wishes to increase spending for
Q143: According to supply-siders, tax cuts should increase
Q148: At any given price level, equilibrium GDP
Q165: Figure 11-1<br> <img src="https://d2lvgg3v3hfg70.cloudfront.net/TB8592/.jpg" alt="Figure 11-1
Q171: Expansionary fiscal policy can cause a rise