Multiple Choice
Figure 17-2
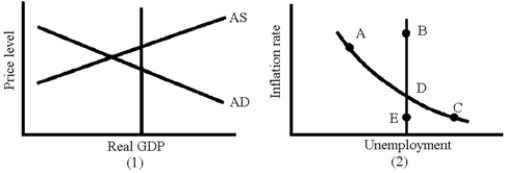
-Given the situation in graph (1) in Figure 17-2, what movement would be expected in graph (2) from the economy's self-correcting mechanism?
A) A to B
B) A to D
C) C to E
D) D to C
Correct Answer:

Verified
Correct Answer:
Verified
Related Questions
Q9: The Phillips curve assumes that shocks to
Q27: The unemployment rate for the U.S.economy in
Q86: According to rational expectations theory, a long
Q88: If employees and employers always accurately predict
Q90: An inflationary gap will eliminate itself through
Q102: In the 1960s and early 1970s, many
Q116: In the 1990s, the United States benefited
Q137: The economy's self-correcting mechanism to eliminate a
Q159: When the aggregate supply curve shifts adversely,
Q176: Demand-side inflation is normally accompanied by<br>A)falling real