Multiple Choice
Figure 17-4
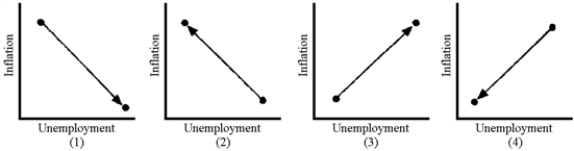
-Which panel in Figure 17-4 shows what happened in 2007-2009?
A) 1
B) 2
C) 3
D) 4
Correct Answer:

Verified
Correct Answer:
Verified
Related Questions
Q18: Keynesian economists generally agree that unemployment is
Q69: Most economists believe that the theory of
Q101: Which of the following is most likely
Q148: In 2010, dissenters were worried that the
Q150: Favorable supply shocks should produce rapid economic
Q154: One way in which the Phillips curve
Q156: The natural rate of unemployment corresponds to
Q157: In 2010 the U.S.economy's inflation rate was
Q174: If the aggregate supply curve is vertical,
Q182: One of the reasons why the Phillips