Multiple Choice
Figure 17-5
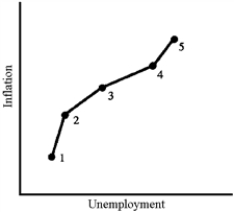
-The data illustrated in Figure 17-5 would be most representative of which decade?
A) the 1960s
B) the 1970s
C) the 1980s
D) the 1990s
Correct Answer:

Verified
Correct Answer:
Verified
Related Questions
Q37: If actual inflation differs from expected inflation,
Q38: What is the crucial difference between inflation
Q43: A Keynesian economist would propose strong actions
Q44: The supply-side shocks of the 1970s shifted
Q60: The most extensive indexing in the United
Q79: In the fall of 2007, most economists
Q115: If expectations are "rational," can the Fed
Q148: The U.S.economy in the 1990s benefited from
Q154: If workers expect inflation, and tend to
Q169: The economy's self-correcting mechanism<br>A)tends to push unemployment