Multiple Choice
Figure 17-8
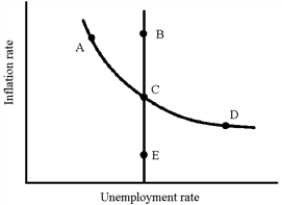
-In Figure 17-8, which of the following movements illustrates the response of the economy to an increase in aggregate demand when expectations are "rational"?
A) C to A
B) C to B
C) C to D
D) C to E
Correct Answer:

Verified
Correct Answer:
Verified
Q30: Which of the following is most likely
Q34: In what way do policymakers have to
Q49: The Phillips curve is a statistical relationship
Q123: Most economists think that, in the short
Q140: If policymakers do nothing in a recessionary
Q160: If the short-run Phillips curve is steep,
Q162: Figure 17-2<br> <img src="https://d2lvgg3v3hfg70.cloudfront.net/TB2282/.jpg" alt="Figure 17-2
Q165: The Phillips curve shows the relationship between
Q168: If you believe that expectations react quickly,
Q197: If the fluctuations in the economy's real