Multiple Choice
Figure 17-8
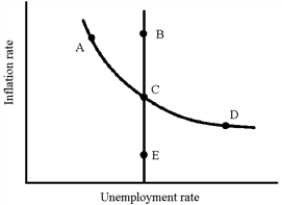
-In Figure 17-8, which of the following points illustrate the expansionary monetary policies of the mid-1990s and the accompanying favorable supply shocks?
A) A to B to C
B) B to C to E
C) C to B to A
D) D to C to E
Correct Answer:

Verified
Correct Answer:
Verified
Q6: As a generalization, it can be said
Q13: The Phillips curve shows the relationship between<br>A)the
Q14: A reduction in aggregate demand will normally
Q67: In the rational expectations model, government control
Q72: In the 1970s, why did the short-run
Q83: Most economists today believe that the Phillips
Q87: The theory of rational expectations says that<br>A)workers
Q149: Most economists and policymakers decided in 2007-2010
Q157: If AD and AS increase at exactly
Q211: The Phillips curve is built on the