Multiple Choice
Figure 20-5
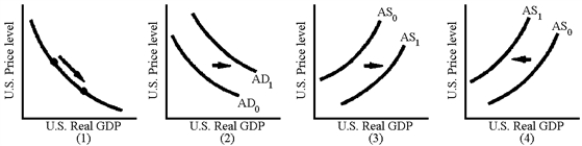
-Which of the graphs in Figure 20-5 are consistent with a depreciation of the U.S.dollar and an increase in net exports caused by a decrease in U.S.interest rates?
A) 1
B) 2
C) 3
D) 4
Correct Answer:

Verified
Correct Answer:
Verified
Related Questions
Q5: The trade deficit is the mirror image
Q8: Figure 20-2<br> <img src="https://d2lvgg3v3hfg70.cloudfront.net/TB2282/.jpg" alt="Figure 20-2
Q13: The dramatic rise in the dollar between
Q18: Economic theory shows that the current account
Q73: The U.S.trade deficits of the 1980s and
Q80: An increase in the value of the
Q93: Suppose that the Fed decides to decrease
Q113: Which of the following is correct?<br>A)Current account
Q133: What are the economic effects of a
Q154: In an open economy, an increase in