Multiple Choice
Use the figure below to answer the following questions.
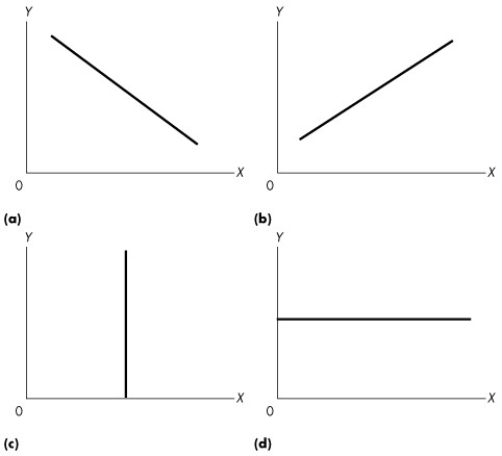
Figure 1A.2.3
-Refer to Figure 1A.2.3. If your theory predicted that a rise in the wage rate (x) leads to a rise in the amount of labour supplied in the economy (y) , which graph would you use to represent this relationship?
A) (a)
B) (b)
C) (c)
D) (d)
E) (a) or (c)
Correct Answer:

Verified
Correct Answer:
Verified
Q25: Use the figure below to answer the
Q38: Use the table below to answer the
Q46: The Latin term ceteris paribus means<br>A)"Innocent until
Q50: Before starring as Tony Stark in Iron
Q52: The two big economic questions include all
Q54: Which one of the following news headlines
Q55: Sue, who has a law degree, earns
Q69: Which of the following statements are true
Q127: Use the table below to answer the
Q187: When the government chooses to use resources