Multiple Choice
Use the figure below to answer the following questions.
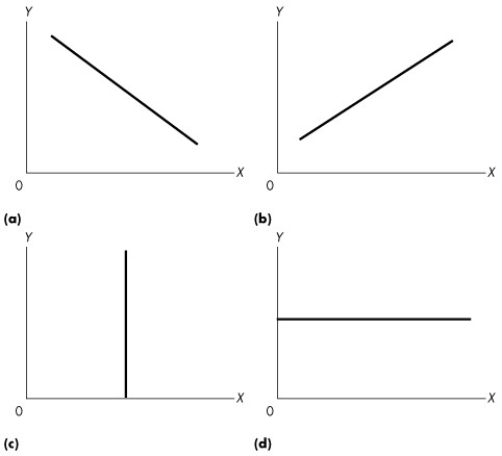
Figure 1A.2.3
-Refer to Figure 1A.2.3. Suppose our theory predicted that for low levels of quantity produced (x) a firm's profits (y) were low, for medium levels of output their profits were high, and for high levels of output their profits were low again. Which one of the graphs would represent this relationship?
A) (a)
B) (b)
C) (c)
D) (d)
E) none of the graphs
Correct Answer:

Verified
Correct Answer:
Verified
Q15: Use the figure below to answer the
Q25: Use the figure below to answer the
Q42: Use the table below to answer the
Q44: Use the figure below to answer the
Q45: "The rich face higher income tax rates
Q46: The Latin term ceteris paribus means<br>A)"Innocent until
Q50: Before starring as Tony Stark in Iron
Q127: Use the table below to answer the
Q170: When Al makes the statement,"The cost of
Q188: Use the figure below to answer the