Multiple Choice
Use the figure below to answer the following question.
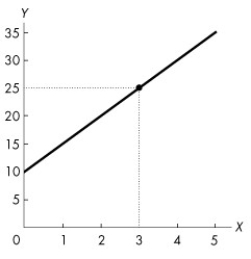
Figure 1A.5.4
-Refer to Figure 1A.5.4. The graph shows the relationship between two variables, x and y. This relationship is described by the equation
A) y = 5x2 + 10.
B) y = 10x + 5.
C) y = -5x + 10.
D) y = 5x + 10.
E) x = 10 + 5y.
Correct Answer:

Verified
Correct Answer:
Verified
Q13: A positive statement is<br>A)about what ought to
Q15: Use the figure below to answer the
Q16: Use the figure below to answer the
Q18: Use the figure below to answer the
Q19: Which one of the following is a
Q22: Use the figure below to answer the
Q87: Which one of the following topics does
Q91: The two big economic questions<br>A)involve self-interest only.<br>B)involve
Q140: A normative statement is<br>A)about what ought to
Q191: To earn income,people sell the services of