Multiple Choice
Use the figure below to answer the following question.
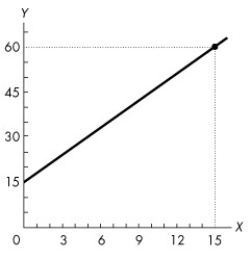
Figure 1A.5.5
-Refer to Figure 1A.5.5. The graph shows the relationship between two variables, x and y. Which of the following equations describes this relationship?
A) y = 3x + 15
B) y = -3x + 15
C) y = -3x2 + 15
D) y = 15x + 3
E) x = 15y + 3
Correct Answer:

Verified
Correct Answer:
Verified
Q58: Marginal benefit is<br>A)the cost of an increase
Q85: Which of the following relates factors of
Q95: The creation of a successful movie can
Q100: The problem of scarcity exists<br>A)only in economies
Q104: Choose the correct statement.<br>A)Canada produces more services
Q109: Use the figure below to answer the
Q110: If the equation of a straight line
Q149: Select the best statement about economic models.<br>A)An
Q164: Which statement about incomes earned by factors
Q197: Operators of private dog parks in your