Multiple Choice
Use the figure below to answer the following questions.
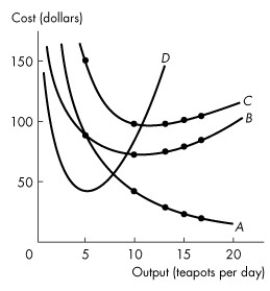
Figure 11.3.2
-Refer to Figure 11.3.2, which illustrates the short-run average and marginal cost curves. The average variable cost curve is curve
A) A.
B) B.
C) C.
D) D.
E) C minus curve B
Correct Answer:

Verified
Correct Answer:
Verified
Q1: Diseconomies of scale are present when<br>A)the LRAC
Q8: Table 11.2.1<br> <img src="https://d2lvgg3v3hfg70.cloudfront.net/TB3019/.jpg" alt="Table 11.2.1
Q9: Use the table below to answer the
Q16: Table 11.2.1<br> <img src="https://d2lvgg3v3hfg70.cloudfront.net/TB3019/.jpg" alt="Table 11.2.1
Q17: Which of the following quotes best illustrates
Q28: Which one of the following statements is
Q50: The MC curve shifts upward if<br>A)factor prices
Q64: The marginal product of capital is the<br>A)change
Q128: When the marginal product of labour is
Q130: Which of the following are correct? According