Multiple Choice
Use the figure below to answer the following question.
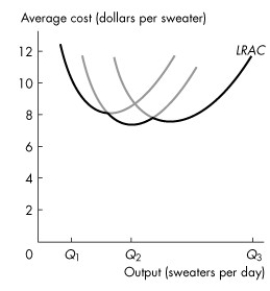
Figure 11.4.3
-Refer to Figure 11.4.3 which shows a firm's long-run average total cost curve. An increase in production from Q₁ to Q₂ sweaters per day produces
A) the minimum efficient scale.
B) economies of scale.
C) diseconomies of scale.
D) constant total costs.
E) constant returns to scale.
Correct Answer:

Verified
Correct Answer:
Verified
Q10: Plant refers to those factors of production<br>A)that
Q14: Marginal cost equals<br>A)TC/Q.<br>B)Q/TVC.<br>C)(TC - TVC)/Q.<br>D)TC/ΔQ.<br>E)ΔTC/ΔQ.
Q45: A rise in the price of a
Q63: Use the table below to answer the
Q67: Use the table below to answer the
Q68: Use the figure below to answer the
Q69: A production function is the relationship between
Q70: Use the figure below to answer the
Q83: Average variable cost is at a minimum
Q134: If an increase in output from 5