Multiple Choice
Use the figure below to answer the following questions.
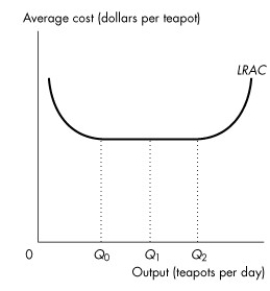
Figure 11.4.4
-Refer to Figure 11.4.4, which illustrates the long-run average total cost curve. Given an increase in output from Q₁ to Q₂,
A) economies of scale exist.
B) diseconomies of scale exist.
C) constant returns to scale exist.
D) average total cost is increasing.
E) average total cost is decreasing.
Correct Answer:

Verified
Correct Answer:
Verified
Q80: If the average variable cost of producing
Q81: Use the figure below to answer the
Q83: Suppose a 1-unit increase in labour, from
Q84: Use the figure below to answer the
Q85: Use the table below to answer the
Q87: Use the figure below to answer the
Q97: Economies of scale are present when<br>A)the LRAC
Q98: Marginal cost is the amount that<br>A)total cost
Q114: Which of the following quotes best illustrates
Q136: The vertical distance between the TC and