Multiple Choice
Use the figure below to answer the following questions.
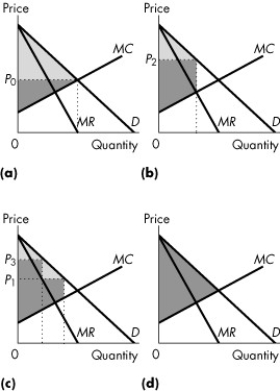
Figure 13.3.2
-Consider Figure 13.3.2. Consider a perfectly competitive market. If the light grey area shows the consumer surplus, and the dark grey area shows the producer surplus, which graph correctly represents this market?
A) (a)
B) (b)
C) (c)
D) (d)
E) (b) and (d)
Correct Answer:

Verified
Correct Answer:
Verified
Q6: An efficient use of resources occurs when<br>A)a
Q30: One difference between perfectly competitive markets and
Q48: If a monopolist can perfectly price discriminate,then<br>A)price
Q49: A perfect price-discriminating monopoly<br>A)has a demand curve
Q85: The creation of a monopoly results in
Q105: Use the figure below to answer the
Q110: A monopolist under marginal cost pricing has
Q110: Use the figure below to answer the
Q113: Use the figure below to answer the
Q114: Use the figure below to answer the