Multiple Choice
Use the figure below to answer the following questions.
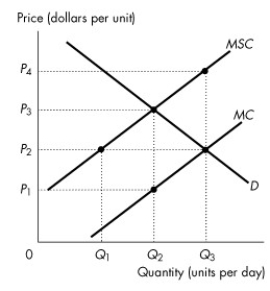
Figure 16.2.1
-Refer to Figure 16.2.1. The figure shows the marginal private cost curve, the marginal social cost curve and the market demand curve. If the market is unregulated, then the quantity produced is
A) zero.
B) Q₁.
C) Q₂.
D) Q₃.
E) too low.
Correct Answer:

Verified
Correct Answer:
Verified
Q7: The outcome from a voucher scheme is
Q33: Three ways governments can encourage production of
Q78: Which of the following is least likely
Q99: Use the figure below to answer the
Q101: Use the figure below to answer the
Q104: A battery acid producer pollutes the water
Q105: An externality is a cost or benefit
Q106: Use the figure below to answer the
Q108: A private subsidy on a good<br>A)is similar
Q108: Which of the following illustrates the concept