Multiple Choice
Use the figure below to answer the following questions.
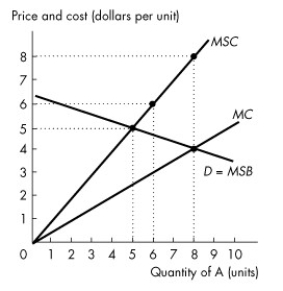
Figure 16.2.2
-Refer to Figure 16.2.2. This figure shows the demand curve, the marginal private cost curve and the marginal social cost curve of good A. How many units of good A are produced in an unregulated market?
A) 0 units
B) 5 units
C) 6 units
D) 8 units
E) 9 units
Correct Answer:

Verified
Correct Answer:
Verified
Q31: Suppose that recycling rubber for running shoes
Q45: The devices the government can use to
Q46: A voucher can eliminate the deadweight loss
Q84: Use the figure below to answer the
Q85: Use the table below to answer the
Q88: Environment Canada was created in<br>A)1971.<br>B)1961.<br>C)1981.<br>D)1991.<br>E)2001.
Q91: The government department charged with monitoring and
Q92: Use the table below to answer the
Q93: Consider some type of industrial pollution that
Q94: The Coase theorem tells us that in