Multiple Choice
Use the figure below to answer the following questions.
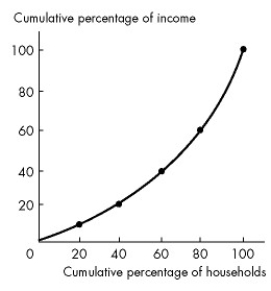
Figure 19.1.1
-Refer to Figure 19.1.1. The poorest 20 percent of households receive what share of total income?
A) 40 percent
B) 60 percent
C) 20 percent
D) 5 percent
E) 10 percent
Correct Answer:

Verified
Correct Answer:
Verified
Related Questions
Q1: The main reason that wealth inequality persists
Q4: Use the table below to answer the
Q6: Between 1976 and 2011, the Canadian Gini
Q7: Which diagram is used by economists to
Q8: Use the figure below to answer the
Q11: Use the figure below to answer the
Q12: Household characteristics that stand out when determining
Q13: In 2011, the middle 20 percent of
Q51: Technological change _ the demand for high-skilled
Q62: Discrimination _ workers in the group being