Multiple Choice
Use the figure below to answer the following questions.
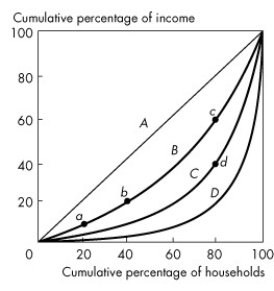
Figure 19.1.2
-Consider the Lorenz curves in Figure 19.1.2. Which point indicates that the richest 20 percent of families earn 60 percent of the income?
A) a
B) b
C) c
D) d
E) the origin
Correct Answer:

Verified
Correct Answer:
Verified
Q13: Assortative mating means that<br>A)poor men tend to
Q20: A Lorenz curve illustrates the distribution of
Q21: Table 19.4.2<br> <img src="https://d2lvgg3v3hfg70.cloudfront.net/TB3019/.jpg" alt="Table 19.4.2
Q22: Since 1976 the Canadian Gini ratio has<br>A)decreased
Q24: If the supply of labour curve is
Q26: Use the figure below to answer the
Q27: Market income equals<br>A)the wages, interest, rent, and
Q28: The Gini coefficient for a perfectly equal
Q30: Use the information below to answer the
Q71: Economists who have compared the incomes of