Multiple Choice
Use the figure below to answer the following questions.
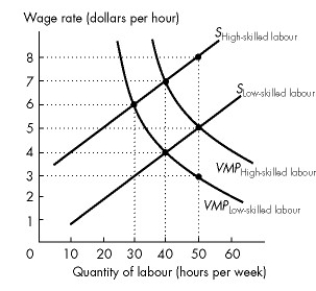
Figure 19.3.5
-Refer to Figure 19.3.5. This figure shows the labour supply curves and the value of marginal product curves for high-skilled and low-skilled workers. The equilibrium wage rate for low-skilled workers is
A) $3 an hour.
B) $7 an hour.
C) $6 an hour.
D) $5 an hour.
E) $4 an hour.
Correct Answer:

Verified
Correct Answer:
Verified
Q33: If the area between the line of
Q79: Between 1970 and 2005,the world Gini ratio
Q85: After-tax income equals<br>A)total income minus tax payments
Q89: Policies that result in a redistribution of
Q93: In 2011, what percentage of households received
Q95: Use the figure below to answer the
Q98: Use the figure below to answer the
Q99: In 2011, the poorest 20 percent of
Q99: If each household made the same amount
Q101: Use the information below to answer the