Multiple Choice
Use the figure below to answer the following questions.
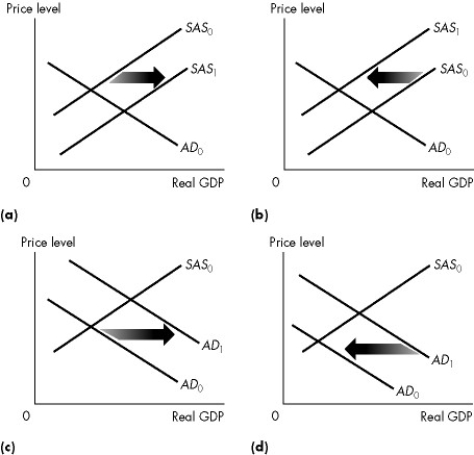
Figure 26.1.1
-Refer to Figure 26.1.1. Which graph illustrates what happens when factor prices rise?
A) (a)
B) (b)
C) (c)
D) (d)
E) (a) and (b)
Correct Answer:

Verified
Correct Answer:
Verified
Q106: Which of the following news quotes best
Q107: Use the figure below to answer the
Q108: Short-run macroeconomic equilibrium always occurs when the<br>A)economy
Q109: The economy cannot remain indefinitely with real
Q110: Use the figure below to answer the
Q112: Aggregate demand is the relationship between<br>A)real aggregate
Q113: Which of the following will lower the
Q114: A _ macroeconomist believes that business cycle
Q115: Canada's exports to the European Union boom.
Q116: Keynesian macroeconomists recommend<br>A)an increase in the quantity