Multiple Choice
Use the figure below to answer the following questions.
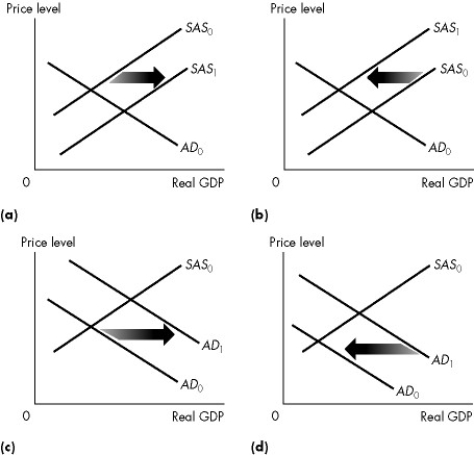
Figure 26.2.1
-Refer to Figure 26.2.1. Which graph illustrates what happens when the quantity of money decreases?
A) (a) only
B) (b) only
C) (c) only
D) (d) only
E) Both (b) and (d)
Correct Answer:

Verified
Correct Answer:
Verified
Q6: Economic growth results when there are increases
Q7: The short-run aggregate supply curve indicates<br>A)the relationship
Q9: Use the figure below to answer the
Q10: Beginning at a long-run equilibrium, an increase
Q12: Use the figure below to answer the
Q13: Use the figure below to answer the
Q14: Which one of the following shifts the
Q15: Aggregate demand<br>A)measures the amount of a nation's
Q16: Which one of the following newspaper quotations
Q103: Canadian businesses expect future profits to rise.Starting