Multiple Choice
Use the figure below to answer the following questions.
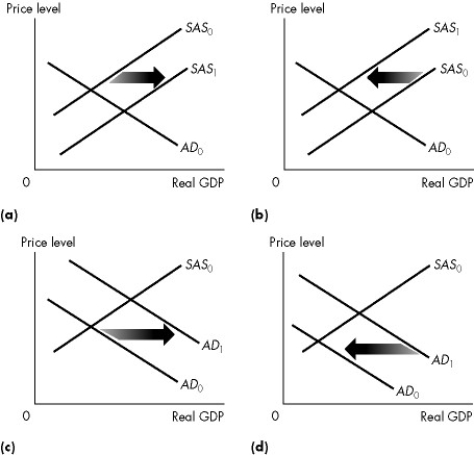
Figure 26.2.1
-Refer to Figure 26.2.1. Which graph illustrates what happens when government expenditure decreases?
A) (a) only
B) (b) only
C) (c) only
D) (d) only
E) Both (a) and (d)
Correct Answer:

Verified
Correct Answer:
Verified
Related Questions
Q75: Use the figure below to answer the
Q76: All of the following will raise the
Q77: Consider the following events: Event 1: Growth
Q78: Use the table below to answer the
Q79: Use the figure below to answer the
Q81: Everything else remaining the same, an increase
Q82: Which of the following statements about the
Q83: An inflationary gap is the amount by
Q84: If a change in wealth is induced
Q85: When an economy is operating on its