Multiple Choice
Use the figure below to answer the following questions.
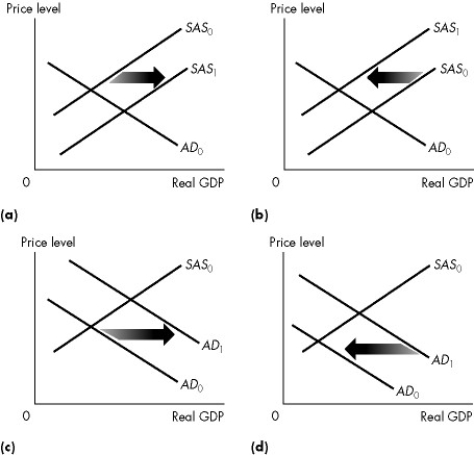
Figure 26.2.1
-Refer to Figure 26.2.1. Which graph illustrates what happens when the quantity of money increases?
A) (a) only
B) (b) only
C) (c) only
D) (d) only
E) Both (b) and (c)
Correct Answer:

Verified
Correct Answer:
Verified
Related Questions
Q35: An increase in the money wage rate
Q36: We observe a decrease in the price
Q37: Use the figure below to answer the
Q38: The long-run aggregate supply curve is vertical
Q39: Use the table below to answer the
Q41: Foreign exchange dealers expect the Canadian dollar
Q42: Use the figure below to answer the
Q43: Everything else remaining the same, an increase
Q44: Use the table below to answer the
Q45: Use the table below to answer the