Multiple Choice
Use the figure below to answer the following question.
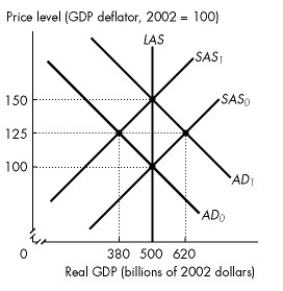
Figure 28.2.1
-Refer to Figure 28.2.1. The figure illustrates an economy initially in equilibrium at the intersection of the SAS₀ curve and the AD₀ curve. Which of the following shifts the short-run aggregate supply curve from SAS₀ to SAS₁?
A) an increase in the price of oil
B) an increase in the price level
C) an increase in the marginal product of labour
D) an increase in the demand for money
E) a decrease in the money wage rate
Correct Answer:

Verified
Correct Answer:
Verified
Q12: Both new Keynesian and new classical cycle
Q13: If there is a fully anticipated increase
Q14: According to real business cycle theory, an
Q15: According to real business cycle theory, if
Q16: When the price level is rising and,
Q18: Use the figure below to answer the
Q19: Demand-pull inflation can start<br>A)aggregate demand increases.<br>B)aggregate supply
Q20: Which of the following are business cycle
Q21: The Canadian long-run Phillips curve _ when
Q22: Choose the statement that is incorrect.<br>A)In a