Multiple Choice
Use the figure below to answer the following questions.
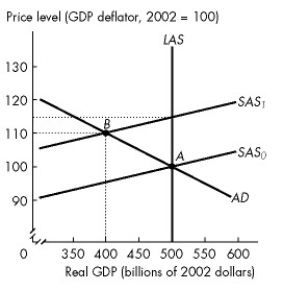
Figure 28.2.2
-Refer to Figure 28.2.2. The vertical distance between SAS₀ and SAS₁ represents the
A) actual inflation rate.
B) expected increase in real GDP.
C) actual decrease in real GDP.
D) expected inflation rate.
E) expected decrease in the real wage rate.
Correct Answer:

Verified
Correct Answer:
Verified
Q54: Use the figure below to answer the
Q55: Which of the following is not a
Q56: The Canadian short-run Phillips curve _ when
Q57: Choose the statement that is incorrect.<br>A)An economy
Q58: A forecast based on all the relevant
Q60: Stagflation is the result of<br>A)a decrease in
Q61: Use the figure below to answer the
Q62: Use the figure below to answer the
Q63: For a given expected inflation rate, the
Q64: Along the short-run Phillips curve, if the