Multiple Choice
Use the figure below to answer the following questions.
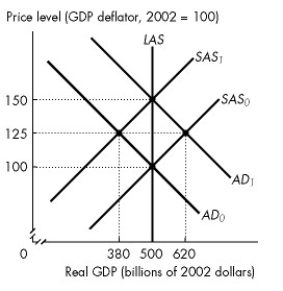
Figure 28.2.3
-Refer to Figure 28.2.3. Assume that the figure illustrates an economy initially in equilibrium at the intersection of the SAS₀ curve and the AD₀ curve. If the aggregate demand curve is expected to shift to AD₁ but remains at AD₀, the new equilibrium real GDP is ________ and the new equilibrium price level is ________.
A) $380 billion; 100
B) $500 billion; 150
C) $500 billion; 100
D) $620 billion; 125
E) $380 billion; 125
Correct Answer:

Verified
Correct Answer:
Verified
Q27: Suppose the economy is in long-run equilibrium
Q28: Suppose that in response to a decrease
Q29: Use the figure below to answer the
Q30: According to mainstream business cycle theory, _
Q31: Inflation that starts because aggregate demand increases
Q33: Suppose aggregate demand increases by more than
Q34: Which one of the following can start
Q35: Use the figure below to answer the
Q36: An increase in the expected rate of
Q37: In real business cycle theory, _ are