Multiple Choice
Use the figure below to answer the following question.
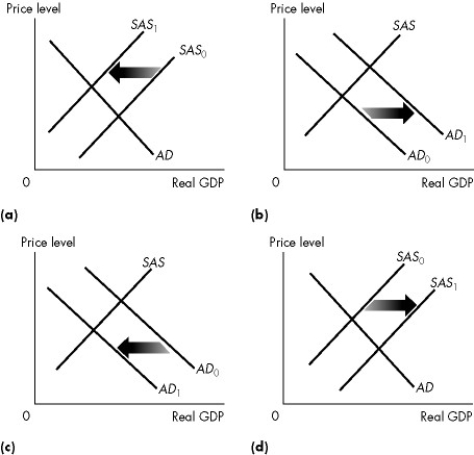
Figure 28.2.5
-Refer to Figure 28.2.5. Which one of the graphs in the figure represents an economy experiencing stagflation?
A) (a) only
B) (b) only
C) (c) only
D) (d) only
E) Both (a) and (c)
Correct Answer:

Verified
Correct Answer:
Verified
Related Questions
Q68: The factor leading to business cycles in
Q69: The key difference between new classical cycle
Q70: A correctly anticipated increase in the quantity
Q71: Suppose that a severe shock that decreases
Q72: The new classical theory argues that the
Q74: Use the figure below to answer the
Q75: Use the figure below to answer the
Q76: Use the figure below to answer the
Q77: "Intertemporal substitution" in real business cycle theory
Q78: Deflation ends with<br>A)an increase in the growth