Multiple Choice
Use the figure below to answer the following questions.
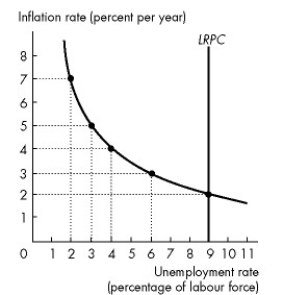
Figure 28.4.1
-Refer to Figure 28.4.1. The figure illustrates an economy's Phillips curves. What is the expected inflation rate?
A) 9 percent
B) 4 percent
C) 2 percent
D) 7 percent
E) cannot be determined without more information
Correct Answer:

Verified
Correct Answer:
Verified
Q19: Demand-pull inflation can start<br>A)aggregate demand increases.<br>B)aggregate supply
Q20: Which of the following are business cycle
Q21: The Canadian long-run Phillips curve _ when
Q22: Choose the statement that is incorrect.<br>A)In a
Q23: According to _ theory, a decrease in
Q25: Use the figure below to answer the
Q26: According to real business cycle theory, a
Q27: Suppose the economy is in long-run equilibrium
Q28: Suppose that in response to a decrease
Q29: Use the figure below to answer the