Multiple Choice
Use the figure below to answer the following questions.
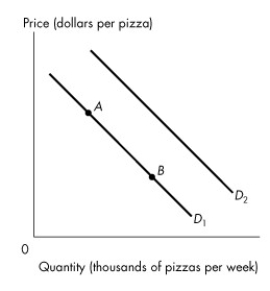
Figure 3.2.2
-Refer to Figure 3.2.2. If consumers' income increases,
A) the quantity of pizzas demanded increases.
B) the demand curve for pizzas shifts from D₁ to D₂ if a pizza is a normal good.
C) the supply of pizzas increases.
D) the quantity of pizzas supplied decreases.
E) a movement from point A to point B on D₁ occurs.
Correct Answer:

Verified
Correct Answer:
Verified
Q30: Use the figure below to answer the
Q31: Use the table below to answer the
Q33: The demand curve slopes downward to the
Q36: The price of good A rises,and the
Q37: Use the information below to answer the
Q39: An increase in supply is shown by<br>A)a
Q67: People buy more of good 1 when
Q75: If we observe an increase in the
Q137: If the market for Twinkies is in
Q178: Suppose we observe a rise in the