Multiple Choice
Refer to the figure below to answer the following questions.
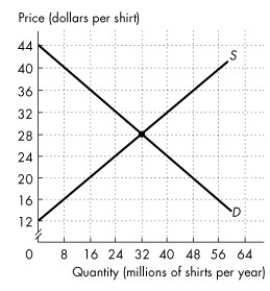
The figure shows the market for shirts in Canada, where D is the domestic demand curve and S is the domestic supply curve. The world price is $20 per shirt.
Figure 31.1.1
-In Figure 31.1.1, with international trade ________ million shirts per year are produced in Canada.
A) 48
B) 32
C) 20
D) 56
E) 16
Correct Answer:

Verified
Correct Answer:
Verified
Q23: The gains from free trade are enjoyed
Q29: Import quotas<br>A)are the same as tariffs.<br>B)are not
Q34: Tariffs<br>A)generate revenue for consumers.<br>B)generate revenue for the
Q54: Offshore outsourcing occurs when a firm in
Q56: Canada has a comparative advantage in producing
Q58: Two reasons that explain why international trade
Q61: Canada produces both lumber and wine. Canada
Q62: Goods and services that we buy from
Q64: When an import quota is imposed, the
Q125: Suppose the country of Mooland imposes tariffs