Multiple Choice
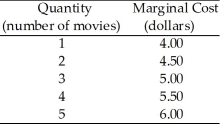
Table 5.2.3
-Consider the demand and supply curves in Figure 5.2.3. If the market is at the competitive equilibrium, which area in the diagram indicates the cost of producing the quantity sold?
A) ABC
B) AEC
C) EBC
D) 0BCD
E) 0ECD
Correct Answer:

Verified
Correct Answer:
Verified
Related Questions
Q4: According to the "big tradeoff,"<br>A)income transfers reduce
Q6: A supply curve is<br>A)the same as a
Q20: As a method of resource allocation,force<br>A)plays a
Q26: Use the figure below to answer the
Q48: Use the figure below to answer the
Q54: An idea of fairness that emphasizes equality
Q56: When a market price allocates a scarce
Q85: The symmetry principle is based on<br>A)the idea
Q87: Which of the following is true?<br>A)When resources
Q100: Use the figure below to answer the