Multiple Choice
Use the figure below to answer the following questions.
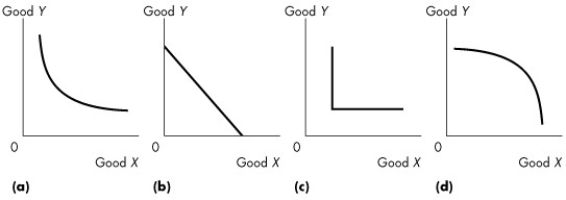
Figure 9.2.1
-Which of the graphs in Figure 9.2.1 shows perfect complements?
A) (a)
B) (b)
C) (c)
D) (d)
E) (c) and (d)
Correct Answer:

Verified
Correct Answer:
Verified
Related Questions
Q7: When the price of a good changes,the
Q29: If the price of the good measured
Q37: When price rises,the substitution effect<br>A)always increases consumption.<br>B)increases
Q61: What is the relationship between goods and
Q76: Zarina can afford to buy 3 tomatoes
Q79: Use the figure below to answer the
Q90: When speaking of the price of the
Q93: Which of the following statements is false?<br>A)A
Q101: A change in the price of the
Q105: Use the information below to answer the