Multiple Choice
You are analyzing sales data and eating habits of students in a school cafeteria, you created a PivotTable with Date as a ROW and Extended Price as a summed VALUE.Which of the following Pivot Tables would demonstrate best what would happen if you added Category to the COLUMNS area?
A) 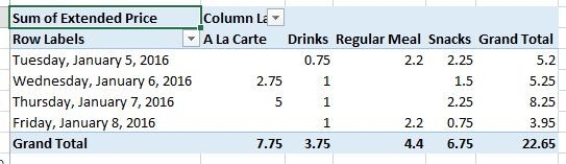
B) 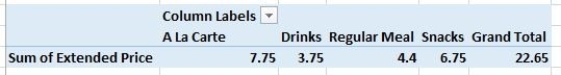
C) 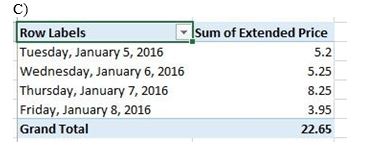
D) 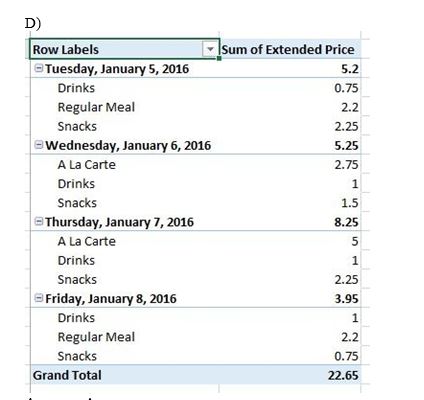
Correct Answer:

Verified
Correct Answer:
Verified
Related Questions
Q8: The _ function is the default summary
Q9: If you would like to show a
Q10: If you have related data stored in
Q11: Using the % of Grand Total Calculation
Q12: Match each of the following Show Value
Q14: You can clear all fields from a
Q15: How would you add a date filter
Q16: Build a PivotChart in the PivotChart wizard
Q17: What dictates the order of hierarchy of
Q18: The four areas for organizing fields in