Multiple Choice
Scenario 1: The demand model relating the quantity of good XYZ sold (QXYZ) to the price of good (PXYZ) is reported below:
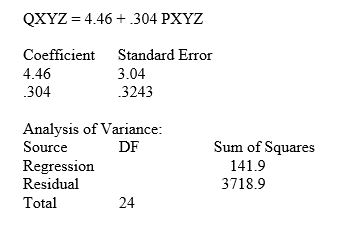
-Refer to Scenario 1.What is the t-statistic for the slope coefficient?
A) 3.04
B) 0.94
C) 0.30
D) 4.46
Correct Answer:

Verified
Correct Answer:
Verified
Related Questions
Q2: The statistical significance of the slope coefficient
Q3: A constant-elasticity demand function can be obtained
Q4: Cross-section data observed at several points in
Q5: Log-linear demand function is also called a
Q6: In which of the following situations would
Q8: Scenario 2: Below is a multiple regression
Q9: Scenario 2: Below is a multiple regression
Q10: Least squares regression minimizes the sum of
Q11: Scenario 2: Below is a multiple regression
Q12: The coefficient of determination is defined as