Multiple Choice
Use the following figure to nswer the question : 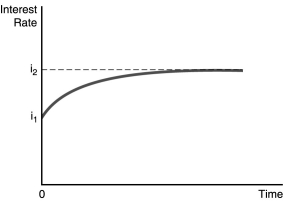
-In the figure above, illustrates the effect of an increased rate of money supply growth at time period 0. From the figure, one can conclude that the
A) liquidity effect is smaller than the expected inflation effect and interest rates adjust quickly to changes in expected inflation.
B) liquidity effect is larger than the expected inflation effect and interest rates adjust quickly to changes in expected inflation.
C) liquidity effect is larger than the expected inflation effect and interest rates adjust slowly to changes in expected inflation.
D) liquidity effect is smaller than the expected inflation effect and interest rates adjust slowly to changes in expected inflation.
Correct Answer:

Verified
Correct Answer:
Verified
Q110: Holding many risky assets and thus reducing
Q111: If prices in the diamond market become
Q112: You would be less willing to purchase
Q113: In a business cycle expansion,the _ of
Q114: <img src="https://d2lvgg3v3hfg70.cloudfront.net/TB1007/.jpg" alt=" -In the figure
Q116: Everything else held constant,during a business cycle
Q117: _ in the money supply in the
Q118: Holding everything else constant,if interest rates are
Q119: In the market for money,a decline in
Q120: <img src="https://d2lvgg3v3hfg70.cloudfront.net/TB1007/.jpg" alt=" - In the