Multiple Choice
Use the following figure to nswer the question : 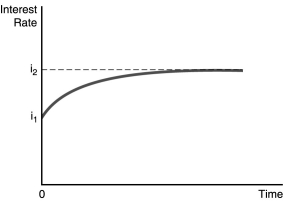
-In the figure above,illustrates the effect of an increased rate of money supply growth at time period 0. From the figure,one can conclude that the
A) Fisher effect is dominated by the liquidity effect and interest rates adjust slowly to changes in expected inflation.
B) liquidity effect is dominated by the Fisher effect and interest rates adjust slowly to changes in expected inflation.
C) liquidity effect is dominated by the Fisher effect and interest rates adjust quickly to changes in expected inflation.
D) Fisher effect is smaller than the expected inflation effect and interest rates adjust quickly to changes in expected inflation.
Correct Answer:

Verified
Correct Answer:
Verified
Q6: If wealth increases,the demand for stocks _
Q7: Everything else held constant,an increase in expected
Q8: When stock prices become more volatile,the _
Q9: The demand for silver decreases,other things equal,when<br>A)the
Q10: Holding everything else equal,if the expected return
Q12: In the market for money,a lower level
Q13: In Keynes's liquidity preference framework,individuals are assumed
Q14: If fluctuations in interest rates become smaller,then,other
Q15: In the loanable funds framework,the _ is
Q16: Keynes assumed that money has _ rate