Multiple Choice
Use the following figure to nswer the question : 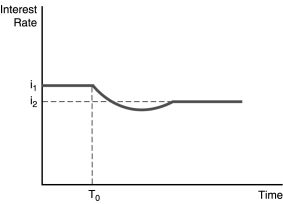
-The figure above illustrates the effect of an increased rate of money supply growth at time period T0. From the figure,one can conclude that the
A) liquidity effect is smaller than the expected inflation effect and interest rates adjust quickly to changes in expected inflation.
B) liquidity effect is larger than the expected inflation effect and interest rates adjust quickly to changes in expected inflation.
C) liquidity effect is larger than the expected inflation effect and interest rates adjust slowly to changes in expected inflation.
D) liquidity effect is smaller than the expected inflation effect and interest rates adjust slowly to changes in expected inflation.
Correct Answer:

Verified
Correct Answer:
Verified
Q53: When the price of a bond decreases,all
Q54: When the interest rate on a bond
Q55: When the interest rate changes,<br>A)the demand curve
Q56: Factors that decrease the demand for bonds
Q57: In the market for money,when the price
Q59: In the bond market,the market equilibrium shows
Q60: If prices in the bond market become
Q61: Everything else held constant,when households save less,wealth
Q62: Of the four effects on interest rates
Q63: Everything else held constant,when stock prices become