menu-iconExamlexExamLexServices

Discover

Ask a Question
  1. All Topics
  2. Topic
    Biology
  3. Study Set
    World of the Cell
  4. Exam
    Exam 8: Transport Across Membranes: Overcoming the Permeability Barrier
  5. Question
    The Graph Below Shows the Rate of Transport for Each

The Graph Below Shows the Rate of Transport for Each

Question 30

Question 30

Not Answered

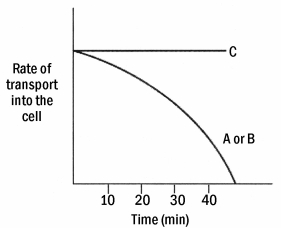
The graph below shows the rate of transport for each substance when the cells are placed in 0.10 mM solutions of A,B,and C.Based on these data and coupled with the data observed above,substance C is transported via ________.

Correct Answer:

verifed

Verified

Unlock this answer now
Get Access to more Verified Answers free of charge

Related Questions

Q25: Which of the following glucose transporters in

Q26: Transmembrane movement of a substance with a

Q27: The P-type ATPases associated with the movement

Q28: What is the ∆G′ for the inward

Q29: Which of the following measures is used

Q31: While working with a novel cell line,you

Q32: When transporting uncharged molecules across the membrane,which

Q33: In the capillaries of the body tissues,CO₂

Q34: Consider the glucose transporters (GLUT).In the case

Q35: The type of transport ATPase that are

Examlex

ExamLex

About UsContact UsPerks CenterHomeschoolingTest Prep

Work With Us

Campus RepresentativeInfluencers

Links

FaqPricingChrome Extension

Download The App

Get App StoreGet Google Play

Policies

Privacy PolicyTerms of ServiceHonor CodeCommunity Guidelines

Scan To Download

qr-code

Copyright © (2025) ExamLex LLC.

Privacy PolicyTerms Of ServiceHonor CodeCommunity Guidelines