Multiple Choice
The graph below shows a growth curve of E.coli growing in a defined medium containing equal molar amounts of glucose and lactose.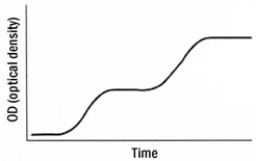
Figure 23.1
Based on your knowledge of the regulation of the lac operon,the best explanation of these results is that
A) early on, due to the presence of lactose, the bacteria utilize the lac operon. Glucose is used later.
B) the bacteria are utilizing both sugars simultaneously.
C) the presence of glucose causes the formation of cAMP catabolic repressor protein (CRP) complexes, which shut down the lac operon until the glucose is used up.
D) glucose is used first. Once glucose becomes limiting, intracellular cAMP increases, forming cAMP-CRP complexes that activate the lac operon to use lactose.
E) none of the above
Correct Answer:

Verified
Correct Answer:
Verified
Q4: Regions of the genome that are inactive
Q5: A bacteria has the following lac operon
Q6: In order to activate genes associated with
Q7: The lac repressor is<br>A)active when glucose is
Q8: You are examining an enzyme associated with
Q10: Which of the following is not a
Q12: The expression of thousands of genes simultaneously
Q13: In eukaryotes,gene amplification is tolerated well when
Q14: Groups of operons that are regulated by
Q20: Genes that are always "turned on" in