Multiple Choice
Use the figure below to answer the following questions.
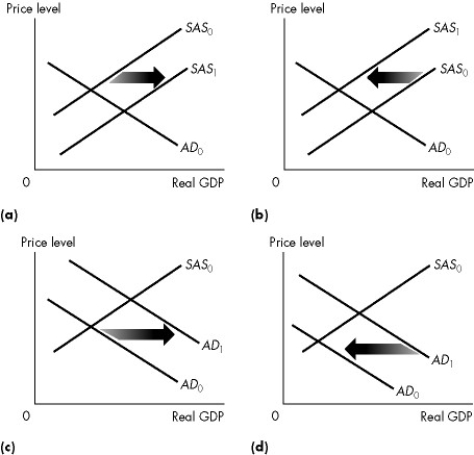
Figure 26.1.1
-Refer to Figure 26.1.1. Which graph illustrates what happens when factor prices decrease?
A) (a)
B) (b)
C) (c)
D) (d)
E) (a) and (b)
Correct Answer:

Verified
Correct Answer:
Verified
Related Questions
Q47: The world goes into an expansion.Starting from
Q126: Use the figure below to answer the
Q127: Use the figure below to answer the
Q129: If real GDP is greater than potential
Q130: Which of the following statements about the
Q131: If real GDP is greater than potential
Q132: Use the figure below to answer the
Q133: Classical macroeconomists recommend<br>A)policies that actively offset changes
Q134: The quantity of real GDP demanded does
Q136: Which one, if any, of the following